
What is Monitoring?
Monitoring is the continuous process of collecting, analyzing, and visualizing system and application metrics to understand the performance, availability, and overall
health of your infrastructure.
What is Prometheus?
Prometheus is a free and open-source tool used to monitor computers, servers, applications, and cloud systems. It helps you collect and store data about how your
system is working like CPU usage, memory, disk space, and more and shows you that data in a way that’s easy to understand.
Prometheus is like a smart assistant that keeps checking how your systems are doing and tells you when something needs your attention.
What is Grafana ?
Grafana is a free and open-source tool used to create beautiful dashboards and visualize monitoring data collected from tools like Prometheus. Instead of looking at
raw numbers, Grafana helps you see graphs, charts, and alerts which makes it easier to understand what’s happening in your system.
Grafana is like a dashboard in a car it shows you everything about your system in one place, in a way that’s easy to see and understand.
Why Use Prometheus + Grafana?
When you use Prometheus and Grafana together, you get a powerful and easy way to monitor your system.
• Prometheus collects data like CPU usage, memory, disk space, and more.
• Grafana shows that data using beautiful graphs and charts.
In short Prometheus watches your system. Grafana shows you what’s happening clearly and beautifully. Together, they make system monitoring easy and smart.
How Prometheus works ?
1. Prometheus asks other tools (called exporters) for system data — like “Hey, what’s the CPU usage now?”
2. Exporters give the data (like CPU: 30%, Memory: 40%).
3. Prometheus stores this data with the time it was collected (this is called “timeseries data”).
4. You can see or analyze this data using its own web page or by connecting it to a tool like Grafana for beautiful dashboards.
How Grafana works ?
1. Grafana connects to Prometheus (or other data sources)
2. It reads the monitoring data (like CPU usage, memory, etc.)
3. You can use Grafana to create dashboards and display that data in graphs
4. You can also set alerts, so Grafana notifies you if something is wrong.
What is Node Exporter?
Node Exporter is a small tool used with Prometheus to collect hardware and system metrics from your Linux server.
It runs on each server (node) you want to monitor and provides important data like:
• CPU usage
• Memory usage
• Disk space
• Network traffic
• System uptime
Prometheus then pulls this data from Node Exporter and stores it for analysis or alerting.
How Node Exporter Works ?
You install Node Exporter on a Linux server. 1.
It starts running and exposes data at:
http://<server-ip>:9100/metrics
2. Prometheus accesses this URL to collect metrics regularly.
3. You can visualize the data in Grafana as graphs, gauges, and charts.
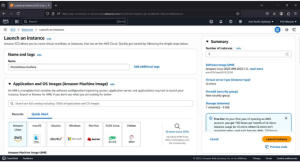
Install Prometheus on EC2 Instance
1. Lunch an Amazon Linux EC2 Instance
2. Execute the below commands to install the Prometheus – copy these all lines and execute as one command
– ——————————————————
sudo tee /etc/yum.repos.d/prometheus.repo <<EOF
[prometheus] name=Prometheus
baseurl=https://packagecloud.io/prometheus-rpm/release/el/7/x86_64
repo_gpgcheck=1 enabled=1
gpgkey=https://packagecloud.io/prometheus-rpm/release/gpgkey
https://raw.githubusercontent.com/lest/prometheus-rpm/master/RPM-
GPGKEY-prometheus-rpm gpgcheck=1 metadata_expire=300
EOF
—————————————————————–
Then:
– sudo yum update -y
– sudo yum -y install prometheus2 node_exporter
– rpm -qi prometheus2
– sudo systemctl start prometheus node_exporter
– sudo systemctl status prometheus.service node_exporter.service
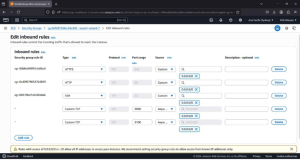
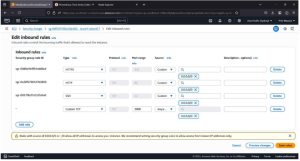
3. add port 9090 for Prometheus and port 9100 for Node Exporter in security group
3. copy ec2 public IP and paste in browser with port no 9090 now you should see Prometheus dashboard.
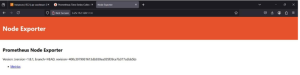
To see Node Exporter copy ec2 public IP and paste in browser with port no 9100
How to Configure Prometheus ?
After installing Prometheus, the most important step is configuring what to monitor — this is done in the prometheus.yml file.
Exporters like Node Exporter, Blackbox Exporter, etc., expose system or service metrics. You tell Prometheus where to find them using scrape_configs.
Example: Adding Node Exporter
1. Open the Prometheus config file:
sudo nano /etc/prometheus/prometheus.yml
2. Add the following lines to the scrape_configs section:
scrape_configs:
– job_name: ‘node_exporter’ static_configs:
– targets: [‘localhost:9100’]
job_name: A label to identify this exporter
targets: Where the exporter is running (IP:port)
3. Restart Prometheus After editing the config file, restart Prometheus to apply changes:
sudo systemctl restart prometheus
4. Open your browser and go to: http://<your-server-ip>:9090
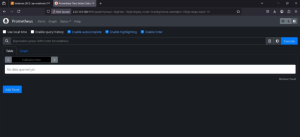
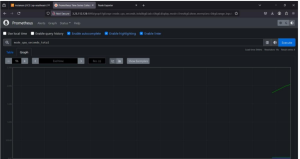
In the Prometheus dashboard, go to the “Targets” page to confirm that node_exporter is active. Click on the “Graph” tab:
• Type any metric starting with node_ (e.g., node_cpu_seconds_total)
• Click “Execute”
• You’ll see live metric data
What is Alert manager in Prometheus ?
Alertmanager is a tool that works with Prometheus to manage and send alerts. Prometheus detects problems, but Alertmanager is the one that sends notifications to you (via Email, Slack, Teams, etc.).
#Detailed setup of Alertmanager is out of scope for this document, but can be explored when implementing advanced alerting.
Install Grafana on EC2 Instance
Install Grafana using the official repository
1. Execute the below commands to install the Prometheus – copy these all lines and execute as one command
sudo tee /etc/yum.repos.d/grafana.repo<<EOF
[grafana] name=Grafana
OSS
baseurl=https://packages.grafana.com/oss/rpm
repo_gpgcheck=1
enabled=1 gpgcheck=1
gpgkey=https://packages.grafana.com/gpg.key EOF
Then:
sudo yum install grafana -y sudo
systemctl start grafana-server sudo
systemctl enable grafana-server After
Installation:
1. add port 3000 in security group of EC2 (Grafana runs on port no 3000).
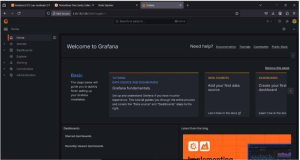
2. copy ec2 public IP and paste in browser with port no 3000 now you should see Grafana dashboard
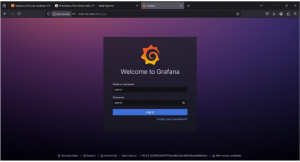
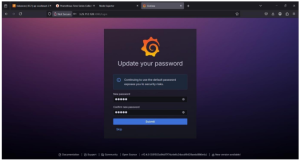
3. login with default username and password which is admin admin
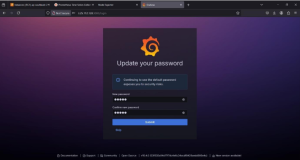
4. You’ll be prompted to set a new password on first login.
Data Source in Grafana
Grafana doesn’t store data itself — it connects to external systems called data sources like:
• Prometheus (for metrics)
• MySQL/PostgreSQL (for databases)
• Elasticsearch
• CloudWatch
• And many others
Once a data source is connected, Grafana can fetch data, visualize it, and build dashboards in real time
How to add Data Source ?
1. Navigate to Data Sources click “Add data source”
2. Select Prometheus from the list
3. Configure Prometheus Settings In the URL field, enter:
• If Prometheus is on the same server: http://localhost:9090
• If Prometheus is on a different server, use: http://<Prometheus-IP>:9090
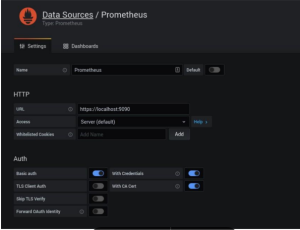
4. Leave the other settings as default click “Save & Test”
You should see a green message: “Data source is working”
What is a Dashboard?
A dashboard in Grafana is a collection of panels that display different types of monitoring data like CPU usage, memory, disk I/O, network traffic, etc., in real-time using graphs, charts, gauges, and tables.
Dashboards make it easy to understand system performance at a glance. Instead of reading raw numbers, you can view the health of your servers, applications, or infrastructure visually.
Start Creating Dashboards
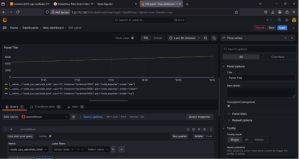
Once Prometheus is connected: Go to the “+” icon on the left click “Dashboard” → then “Add new panel”. Choose Prometheus as the data source
In the metrics browser, start typing metric names like:
• Click Run Query
• A graph will appear with live data
Customize the Visualization
Click the Panel Title → Edit Choose visualization type:
• Graph
• Gauge
• Table
• Pie Chart, etc.
Configure legends, units, colors, and thresholds
a. node_cpu_seconds_total
b. node_memory_MemAvailable_bytes